Baseline
Individual Support Tool’s Variables
- Timeframe 1 Year
- Vaccine Bivalent
- Populations 200
- Health System Budget $1,000 Per Vaccine
- Intervention Cost $10,000 Annually
In the model base case, estimates are calculated using current data on model parameters (e.g., vaccination rates, HPV cancer incidences, costs). Parameters that may be modified from the base case are provided below or can be accessed by clicking on Modifiable Parameters at any point as you’re exploring this page.
Modifiable Parameters
The following parameters that may be modified include:
National-level Results
This table presents national-level estimates of incremental health outcomes and incremental costs for each strategy, relative to usual care.
| Compared to Usual Care | AAT | AAT + Standing Orders | AAT + Financial Incentives | AAT + Vaccine Champions | AFIX | STOP HPV |
|---|---|---|---|---|---|---|
| Num. Additionally Vaccinated | 113,400 | 134,400 | 134,400 | 134,400 | 39,900 | 79,800 |
| Cancer Cases Averted | 900 | 1,000 | 1,000 | 1,000 | 300 | 600 |
| Cancer Deaths Averted | 300 | 400 | 400 | 400 | 100 | 200 |
| Short Term Productivity Losses Averted ($) | $4,326,600 | $5,127,900 | $5,127,900 | $5,127,900 | $1,522,300 | $3,044,700 |
| Long Term Productivity Losses Averted ($) | $10,283,500 | $12,187,900 | $12,187,900 | $12,187,900 | $3,618,300 | $7,236,500 |
| Treatment Costs Averted ($) | $103,887,400 | $123,125,800 | $123,125,800 | $123,125,800 | $36,553,000 | $73,105,900 |
| Intervention costs ($) | $1,300,000 | $1,300,000 | $1,300,000 | $1,300,000 | $1,300,000 | $1,300,000 |
| Incremental QALYs Gained | 4,600 | 5,400 | 5,400 | 5,400 | 1,600 | 3,200 |
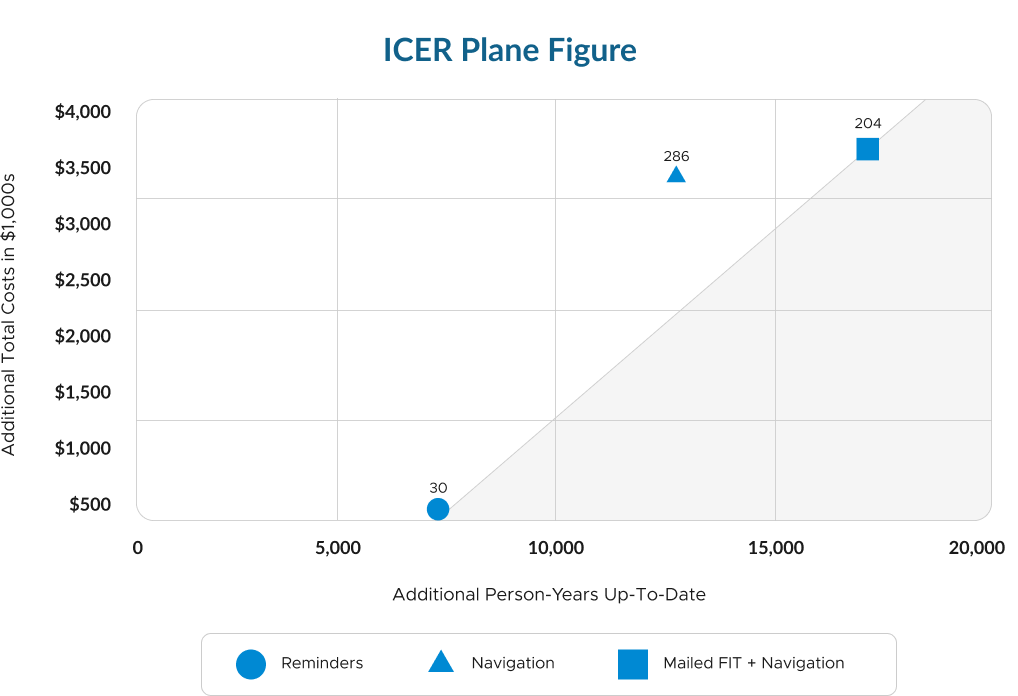
Interpreting the Incremental Cost-Effectiveness Ratio (ICER) Plane
The Incremental Cost-Effectiveness Ratio (or ICER) plane below illustrates the relationship incremental costs (on the y-axis) and incremental effectiveness (on the x-axis) for each intervention, expressed as cost per additional vaccinated person. For example, an ICER of $50 means that intervention costs $50 for each additional person vaccinated compared with usual care. When interpreting these results, lower ICER values indicated greater cost-effectiveness.
Cancer cases averted
| Compared to Usual Care | AAT | AAT + Standing Orders | AAT + Financial Incentives | AAT + Vaccine Champions | AFIX | STOP HPV |
|---|---|---|---|---|---|---|
| Cervical Cancer | 260 | 310 | 310 | 310 | 90 | 180 |
| Oropharyngeal Cancer | 330 | 400 | 400 | 400 | 120 | 240 |
| Vaginal Cancer | 20 | 20 | 20 | 20 | 10 | 10 |
| Vulvar Cancer | 70 | 80 | 80 | 80 | 20 | 50 |
| Anal Cancer | 170 | 200 | 200 | 200 | 60 | 120 |
| Penile Cancer | 20 | 20 | 20 | 20 | 10 | 10 |
State-level Results
Click on a state in the three maps below to view the incremental costs, vaccination coverage changes, and quality-of-life gains associated with each Announcement Approach Training (AAT) intervention, relative to usual care.
AAT + Standing Orders
- Incremental Cost of Intervention:$1,022.2K
- Incremental Vaccination Coverage Gain (%):4.4
- Incremental QALYs Gained:10
- Incremental Cost of Intervention:$981.0K
- Incremental Vaccination Coverage Gain (%):4.7
- Incremental QALYs Gained:100
- Incremental Cost of Intervention:$214.0K
- Incremental Vaccination Coverage Gain (%):4.5
- Incremental QALYs Gained:60
- Incremental Cost of Intervention:$1,111.6K
- Incremental Vaccination Coverage Gain (%):4.5
- Incremental QALYs Gained:90
- Incremental Cost of Intervention:$12,775.9K
- Incremental Vaccination Coverage Gain (%):4.0
- Incremental QALYs Gained:550
- Incremental Cost of Intervention:$710.3K
- Incremental Vaccination Coverage Gain (%):3.9
- Incremental QALYs Gained:70
- Incremental Cost of Intervention:$227.5K
- Incremental Vaccination Coverage Gain (%):3.9
- Incremental QALYs Gained:50
- Incremental Cost of Intervention:$800.2K
- Incremental Vaccination Coverage Gain (%):4.1
- Incremental QALYs Gained:20
- Incremental Cost of Intervention:$11,097.3K
- Incremental Vaccination Coverage Gain (%):4.6
- Incremental QALYs Gained:480
- Incremental Cost of Intervention:$3,339.4K
- Incremental Vaccination Coverage Gain (%):4.3
- Incremental QALYs Gained:190
- Incremental Cost of Intervention:$806.4K
- Incremental Vaccination Coverage Gain (%):3.7
- Incremental QALYs Gained:20
- Incremental Cost of Intervention:$88.5K
- Incremental Vaccination Coverage Gain (%):4.3
- Incremental QALYs Gained:50
- Incremental Cost of Intervention:$620.5K
- Incremental Vaccination Coverage Gain (%):4.4
- Incremental QALYs Gained:20
- Incremental Cost of Intervention:$4,269.1K
- Incremental Vaccination Coverage Gain (%):4.2
- Incremental QALYs Gained:220
- Incremental Cost of Intervention:$1,270.9K
- Incremental Vaccination Coverage Gain (%):4.3
- Incremental QALYs Gained:90
- Incremental Cost of Intervention:$57.5K
- Incremental Vaccination Coverage Gain (%):4.9
- Incremental QALYs Gained:50
- Incremental Cost of Intervention:$1,220.0K
- Incremental Vaccination Coverage Gain (%):4.2
- Incremental QALYs Gained:100
- Incremental Cost of Intervention:$968.0K
- Incremental Vaccination Coverage Gain (%):4.2
- Incremental QALYs Gained:90
- Incremental Cost of Intervention:$1,506.6K
- Incremental Vaccination Coverage Gain (%):3.6
- Incremental QALYs Gained:100
- Incremental Cost of Intervention:$1,108.1K
- Incremental Vaccination Coverage Gain (%):3.8
- Incremental QALYs Gained:90
- Incremental Cost of Intervention:$562.0K
- Incremental Vaccination Coverage Gain (%):4.3
- Incremental QALYs Gained:30
- Incremental Cost of Intervention:$3,103.2K
- Incremental Vaccination Coverage Gain (%):4.1
- Incremental QALYs Gained:150
- Incremental Cost of Intervention:$766.9K
- Incremental Vaccination Coverage Gain (%):3.8
- Incremental QALYs Gained:70
- Incremental Cost of Intervention:$1,762.7K
- Incremental Vaccination Coverage Gain (%):4.5
- Incremental QALYs Gained:120
- Incremental Cost of Intervention:$209.5K
- Incremental Vaccination Coverage Gain (%):5.7
- Incremental QALYs Gained:70
- Incremental Cost of Intervention:$836.5K
- Incremental Vaccination Coverage Gain (%):4.3
- Incremental QALYs Gained:20
- Incremental Cost of Intervention:$3,501.1K
- Incremental Vaccination Coverage Gain (%):3.9
- Incremental QALYs Gained:180
- Incremental Cost of Intervention:$1,056.4K
- Incremental Vaccination Coverage Gain (%):4.0
- Incremental QALYs Gained:10
- Incremental Cost of Intervention:$553.4K
- Incremental Vaccination Coverage Gain (%):3.9
- Incremental QALYs Gained:30
- Incremental Cost of Intervention:$662.3K
- Incremental Vaccination Coverage Gain (%):3.9
- Incremental QALYs Gained:20
- Incremental Cost of Intervention:$2,488.1K
- Incremental Vaccination Coverage Gain (%):4.3
- Incremental QALYs Gained:150
- Incremental Cost of Intervention:$539.7K
- Incremental Vaccination Coverage Gain (%):4.1
- Incremental QALYs Gained:30
- Incremental Cost of Intervention:$101.2K
- Incremental Vaccination Coverage Gain (%):4.4
- Incremental QALYs Gained:50
- Incremental Cost of Intervention:$7,021.4K
- Incremental Vaccination Coverage Gain (%):4.0
- Incremental QALYs Gained:340
- Incremental Cost of Intervention:$4,312.3K
- Incremental Vaccination Coverage Gain (%):4.2
- Incremental QALYs Gained:220
- Incremental Cost of Intervention:$591.9K
- Incremental Vaccination Coverage Gain (%):4.9
- Incremental QALYs Gained:80
- Incremental Cost of Intervention:$597.9K
- Incremental Vaccination Coverage Gain (%):4.0
- Incremental QALYs Gained:60
- Incremental Cost of Intervention:$4,733.3K
- Incremental Vaccination Coverage Gain (%):4.0
- Incremental QALYs Gained:230
- Incremental Cost of Intervention:$822.0K
- Incremental Vaccination Coverage Gain (%):3.4
- Incremental QALYs Gained:20
- Incremental Cost of Intervention:$1,153.3K
- Incremental Vaccination Coverage Gain (%):4.5
- Incremental QALYs Gained:90
- Incremental Cost of Intervention:$961.1K
- Incremental Vaccination Coverage Gain (%):3.8
- Incremental QALYs Gained:10
- Incremental Cost of Intervention:$2,094.0K
- Incremental Vaccination Coverage Gain (%):4.4
- Incremental QALYs Gained:130
- Incremental Cost of Intervention:$9,405.8K
- Incremental Vaccination Coverage Gain (%):4.3
- Incremental QALYs Gained:450
- Incremental Cost of Intervention:$595.3K
- Incremental Vaccination Coverage Gain (%):4.5
- Incremental QALYs Gained:30
- Incremental Cost of Intervention:$1,996.2K
- Incremental Vaccination Coverage Gain (%):4.3
- Incremental QALYs Gained:120
- Incremental Cost of Intervention:$997.9K
- Incremental Vaccination Coverage Gain (%):3.7
- Incremental QALYs Gained:10
- Incremental Cost of Intervention:$1,702.7K
- Incremental Vaccination Coverage Gain (%):4.3
- Incremental QALYs Gained:110
- Incremental Cost of Intervention:$1,110.3K
- Incremental Vaccination Coverage Gain (%):4.0
- Incremental QALYs Gained:90
- Incremental Cost of Intervention:$202.8K
- Incremental Vaccination Coverage Gain (%):5.1
- Incremental QALYs Gained:40
- Incremental Cost of Intervention:$1,079.9K
- Incremental Vaccination Coverage Gain (%):4.9
- Incremental QALYs Gained:10
AAT + Financial Incentives
- Incremental Cost of Intervention:$1,022.2K
- Incremental Vaccination Coverage Gain (%):4.4
- Incremental QALYs Gained:10
- Incremental Cost of Intervention:$981.0K
- Incremental Vaccination Coverage Gain (%):4.7
- Incremental QALYs Gained:100
- Incremental Cost of Intervention:$214.0K
- Incremental Vaccination Coverage Gain (%):4.5
- Incremental QALYs Gained:60
- Incremental Cost of Intervention:$1,111.6K
- Incremental Vaccination Coverage Gain (%):4.5
- Incremental QALYs Gained:90
- Incremental Cost of Intervention:$12,775.9K
- Incremental Vaccination Coverage Gain (%):4.0
- Incremental QALYs Gained:550
- Incremental Cost of Intervention:$710.3K
- Incremental Vaccination Coverage Gain (%):3.9
- Incremental QALYs Gained:70
- Incremental Cost of Intervention:$227.5K
- Incremental Vaccination Coverage Gain (%):3.9
- Incremental QALYs Gained:50
- Incremental Cost of Intervention:$1,020.0K
- Incremental Vaccination Coverage Gain (%):3.7
- Incremental QALYs Gained:10
- Incremental Cost of Intervention:$800.2K
- Incremental Vaccination Coverage Gain (%):4.1
- Incremental QALYs Gained:20
- Incremental Cost of Intervention:$11,097.3K
- Incremental Vaccination Coverage Gain (%):4.6
- Incremental QALYs Gained:480
- Incremental Cost of Intervention:$3,339.4K
- Incremental Vaccination Coverage Gain (%):4.3
- Incremental QALYs Gained:190
- Incremental Cost of Intervention:$806.4K
- Incremental Vaccination Coverage Gain (%):3.7
- Incremental QALYs Gained:20
- Incremental Cost of Intervention:$88.5K
- Incremental Vaccination Coverage Gain (%):4.3
- Incremental QALYs Gained:50
- Incremental Cost of Intervention:$620.5K
- Incremental Vaccination Coverage Gain (%):4.4
- Incremental QALYs Gained:20
- Incremental Cost of Intervention:$4,269.1K
- Incremental Vaccination Coverage Gain (%):4.2
- Incremental QALYs Gained:220
- Incremental Cost of Intervention:$1,270.9K
- Incremental Vaccination Coverage Gain (%):4.3
- Incremental QALYs Gained:90
- Incremental Cost of Intervention:$57.5K
- Incremental Vaccination Coverage Gain (%):4.9
- Incremental QALYs Gained:50
- Incremental Cost of Intervention:$1,220.0K
- Incremental Vaccination Coverage Gain (%):4.2
- Incremental QALYs Gained:100
- Incremental Cost of Intervention:$968.0K
- Incremental Vaccination Coverage Gain (%):4.2
- Incremental QALYs Gained:90
- Incremental Cost of Intervention:$1,506.6K
- Incremental Vaccination Coverage Gain (%):3.6
- Incremental QALYs Gained:100
- Incremental Cost of Intervention:$1,108.1K
- Incremental Vaccination Coverage Gain (%):3.8
- Incremental QALYs Gained:90
- Incremental Cost of Intervention:$562.0K
- Incremental Vaccination Coverage Gain (%):4.3
- Incremental QALYs Gained:30
- Incremental Cost of Intervention:$3,103.2K
- Incremental Vaccination Coverage Gain (%):4.1
- Incremental QALYs Gained:150
- Incremental Cost of Intervention:$766.9K
- Incremental Vaccination Coverage Gain (%):3.8
- Incremental QALYs Gained:70
- Incremental Cost of Intervention:$1,762.7K
- Incremental Vaccination Coverage Gain (%):4.5
- Incremental QALYs Gained:120
- Incremental Cost of Intervention:$209.5K
- Incremental Vaccination Coverage Gain (%):5.7
- Incremental QALYs Gained:70
- Incremental Cost of Intervention:$836.5K
- Incremental Vaccination Coverage Gain (%):4.3
- Incremental QALYs Gained:20
- Incremental Cost of Intervention:$3,501.1K
- Incremental Vaccination Coverage Gain (%):3.9
- Incremental QALYs Gained:180
- Incremental Cost of Intervention:$1,056.4K
- Incremental Vaccination Coverage Gain (%):4.0
- Incremental QALYs Gained:10
- Incremental Cost of Intervention:$553.4K
- Incremental Vaccination Coverage Gain (%):3.9
- Incremental QALYs Gained:30
- Incremental Cost of Intervention:$662.3K
- Incremental Vaccination Coverage Gain (%):3.9
- Incremental QALYs Gained:20
- Incremental Cost of Intervention:$2,488.1K
- Incremental Vaccination Coverage Gain (%):4.3
- Incremental QALYs Gained:150
- Incremental Cost of Intervention:$539.7K
- Incremental Vaccination Coverage Gain (%):4.1
- Incremental QALYs Gained:30
- Incremental Cost of Intervention:$101.2K
- Incremental Vaccination Coverage Gain (%):4.4
- Incremental QALYs Gained:50
- Incremental Cost of Intervention:$7,021.4K
- Incremental Vaccination Coverage Gain (%):4.0
- Incremental QALYs Gained:340
- Incremental Cost of Intervention:$4,312.3K
- Incremental Vaccination Coverage Gain (%):4.2
- Incremental QALYs Gained:220
- Incremental Cost of Intervention:$591.9K
- Incremental Vaccination Coverage Gain (%):4.9
- Incremental QALYs Gained:80
- Incremental Cost of Intervention:$597.9K
- Incremental Vaccination Coverage Gain (%):4.0
- Incremental QALYs Gained:60
- Incremental Cost of Intervention:$4,733.3K
- Incremental Vaccination Coverage Gain (%):4.0
- Incremental QALYs Gained:230
- Incremental Cost of Intervention:$822.0K
- Incremental Vaccination Coverage Gain (%):3.4
- Incremental QALYs Gained:20
- Incremental Cost of Intervention:$1,153.3K
- Incremental Vaccination Coverage Gain (%):4.5
- Incremental QALYs Gained:90
- Incremental Cost of Intervention:$961.1K
- Incremental Vaccination Coverage Gain (%):3.8
- Incremental QALYs Gained:10
- Incremental Cost of Intervention:$2,094.0K
- Incremental Vaccination Coverage Gain (%):4.4
- Incremental QALYs Gained:130
- Incremental Cost of Intervention:$9,405.8K
- Incremental Vaccination Coverage Gain (%):4.3
- Incremental QALYs Gained:450
- Incremental Cost of Intervention:$595.3K
- Incremental Vaccination Coverage Gain (%):4.5
- Incremental QALYs Gained:30
- Incremental Cost of Intervention:$1,996.2K
- Incremental Vaccination Coverage Gain (%):4.3
- Incremental QALYs Gained:120
- Incremental Cost of Intervention:$997.9K
- Incremental Vaccination Coverage Gain (%):3.7
- Incremental QALYs Gained:10
- Incremental Cost of Intervention:$1,702.7K
- Incremental Vaccination Coverage Gain (%):4.3
- Incremental QALYs Gained:110
- Incremental Cost of Intervention:$1,110.3K
- Incremental Vaccination Coverage Gain (%):4.0
- Incremental QALYs Gained:90
- Incremental Cost of Intervention:$202.8K
- Incremental Vaccination Coverage Gain (%):5.1
- Incremental QALYs Gained:40
- Incremental Cost of Intervention:$1,079.9K
- Incremental Vaccination Coverage Gain (%):4.9
- Incremental QALYs Gained:10
AAT + Vaccine Champions
- Incremental Cost of Intervention:$1,022.2K
- Incremental Vaccination Coverage Gain (%):4.4
- Incremental QALYs Gained:10
- Incremental Cost of Intervention:$981.0K
- Incremental Vaccination Coverage Gain (%):4.7
- Incremental QALYs Gained:100
- Incremental Cost of Intervention:$214.0K
- Incremental Vaccination Coverage Gain (%):4.5
- Incremental QALYs Gained:60
- Incremental Cost of Intervention:$1,111.6K
- Incremental Vaccination Coverage Gain (%):4.5
- Incremental QALYs Gained:90
- Incremental Cost of Intervention:$12,775.9K
- Incremental Vaccination Coverage Gain (%):4.0
- Incremental QALYs Gained:550
- Incremental Cost of Intervention:$710.3K
- Incremental Vaccination Coverage Gain (%):3.9
- Incremental QALYs Gained:70
- Incremental Cost of Intervention:$227.5K
- Incremental Vaccination Coverage Gain (%):3.9
- Incremental QALYs Gained:50
- Incremental Cost of Intervention:$800.2K
- Incremental Vaccination Coverage Gain (%):4.1
- Incremental QALYs Gained:20
- Incremental Cost of Intervention:$11,097.3K
- Incremental Vaccination Coverage Gain (%):4.6
- Incremental QALYs Gained:480
- Incremental Cost of Intervention:$3,339.4K
- Incremental Vaccination Coverage Gain (%):4.3
- Incremental QALYs Gained:190
- Incremental Cost of Intervention:$806.4K
- Incremental Vaccination Coverage Gain (%):3.7
- Incremental QALYs Gained:20
- Incremental Cost of Intervention:$88.5K
- Incremental Vaccination Coverage Gain (%):4.3
- Incremental QALYs Gained:50
- Incremental Cost of Intervention:$620.5K
- Incremental Vaccination Coverage Gain (%):4.4
- Incremental QALYs Gained:20
- Incremental Cost of Intervention:$4,269.1K
- Incremental Vaccination Coverage Gain (%):4.2
- Incremental QALYs Gained:220
- Incremental Cost of Intervention:$1,270.9K
- Incremental Vaccination Coverage Gain (%):4.3
- Incremental QALYs Gained:90
- Incremental Cost of Intervention:$57.5K
- Incremental Vaccination Coverage Gain (%):4.9
- Incremental QALYs Gained:50
- Incremental Cost of Intervention:$1,220.0K
- Incremental Vaccination Coverage Gain (%):4.2
- Incremental QALYs Gained:100
- Incremental Cost of Intervention:$968.0K
- Incremental Vaccination Coverage Gain (%):4.2
- Incremental QALYs Gained:90
- Incremental Cost of Intervention:$1,506.6K
- Incremental Vaccination Coverage Gain (%):3.6
- Incremental QALYs Gained:100
- Incremental Cost of Intervention:$1,108.1K
- Incremental Vaccination Coverage Gain (%):3.8
- Incremental QALYs Gained:90
- Incremental Cost of Intervention:$562.0K
- Incremental Vaccination Coverage Gain (%):4.3
- Incremental QALYs Gained:30
- Incremental Cost of Intervention:$3,103.2K
- Incremental Vaccination Coverage Gain (%):4.1
- Incremental QALYs Gained:150
- Incremental Cost of Intervention:$766.9K
- Incremental Vaccination Coverage Gain (%):3.8
- Incremental QALYs Gained:70
- Incremental Cost of Intervention:$1,762.7K
- Incremental Vaccination Coverage Gain (%):4.5
- Incremental QALYs Gained:120
- Incremental Cost of Intervention:$209.5K
- Incremental Vaccination Coverage Gain (%):5.7
- Incremental QALYs Gained:70
- Incremental Cost of Intervention:$836.5K
- Incremental Vaccination Coverage Gain (%):4.3
- Incremental QALYs Gained:20
- Incremental Cost of Intervention:$3,501.1K
- Incremental Vaccination Coverage Gain (%):3.9
- Incremental QALYs Gained:180
- Incremental Cost of Intervention:$1,056.4K
- Incremental Vaccination Coverage Gain (%):4.0
- Incremental QALYs Gained:10
- Incremental Cost of Intervention:$553.4K
- Incremental Vaccination Coverage Gain (%):3.9
- Incremental QALYs Gained:30
- Incremental Cost of Intervention:$662.3K
- Incremental Vaccination Coverage Gain (%):3.9
- Incremental QALYs Gained:20
- Incremental Cost of Intervention:$2,488.1K
- Incremental Vaccination Coverage Gain (%):4.3
- Incremental QALYs Gained:150
- Incremental Cost of Intervention:$539.7K
- Incremental Vaccination Coverage Gain (%):4.1
- Incremental QALYs Gained:30
- Incremental Cost of Intervention:$101.2K
- Incremental Vaccination Coverage Gain (%):4.4
- Incremental QALYs Gained:50
- Incremental Cost of Intervention:$7,021.4K
- Incremental Vaccination Coverage Gain (%):4.0
- Incremental QALYs Gained:340
- Incremental Cost of Intervention:$4,312.3K
- Incremental Vaccination Coverage Gain (%):4.2
- Incremental QALYs Gained:220
- Incremental Cost of Intervention:$591.9K
- Incremental Vaccination Coverage Gain (%):4.9
- Incremental QALYs Gained:80
- Incremental Cost of Intervention:$597.9K
- Incremental Vaccination Coverage Gain (%):4.0
- Incremental QALYs Gained:60
- Incremental Cost of Intervention:$4,733.3K
- Incremental Vaccination Coverage Gain (%):4.0
- Incremental QALYs Gained:230
- Incremental Cost of Intervention:$822.0K
- Incremental Vaccination Coverage Gain (%):3.4
- Incremental QALYs Gained:20
- Incremental Cost of Intervention:$1,153.3K
- Incremental Vaccination Coverage Gain (%):4.5
- Incremental QALYs Gained:90
- Incremental Cost of Intervention:$961.1K
- Incremental Vaccination Coverage Gain (%):3.8
- Incremental QALYs Gained:10
- Incremental Cost of Intervention:$2,094.0K
- Incremental Vaccination Coverage Gain (%):4.4
- Incremental QALYs Gained:130
- Incremental Cost of Intervention:$9,405.8K
- Incremental Vaccination Coverage Gain (%):4.3
- Incremental QALYs Gained:450
- Incremental Cost of Intervention:$595.3K
- Incremental Vaccination Coverage Gain (%):4.5
- Incremental QALYs Gained:30
- Incremental Cost of Intervention:$1,996.2K
- Incremental Vaccination Coverage Gain (%):4.3
- Incremental QALYs Gained:120
- Incremental Cost of Intervention:$997.9K
- Incremental Vaccination Coverage Gain (%):3.7
- Incremental QALYs Gained:10
- Incremental Cost of Intervention:$1,702.7K
- Incremental Vaccination Coverage Gain (%):4.3
- Incremental QALYs Gained:110
- Incremental Cost of Intervention:$1,110.3K
- Incremental Vaccination Coverage Gain (%):4.0
- Incremental QALYs Gained:90
- Incremental Cost of Intervention:$202.8K
- Incremental Vaccination Coverage Gain (%):5.1
- Incremental QALYs Gained:40
- Incremental Cost of Intervention:$1,079.9K
- Incremental Vaccination Coverage Gain (%):4.9
- Incremental QALYs Gained:10
US Rural and Urban Results
The following tables present estimates of incremental health outcomes and incremental costs for each strategy, relative to usual care, stratified by rural and urban U.S. populations.
Rural
| Compared to Usual Care | AAT | AAT + Standing Orders | AAT + Financial Incentives | AAT + Vaccine Champions | AFIX | STOP HPV |
|---|---|---|---|---|---|---|
| Num. Additionally Vaccinated | 98,500 | 116,700 | 116,700 | 116,700 | 34,600 | 69,300 |
| Cancer Cases Averted | 700 | 900 | 900 | 900 | 300 | 500 |
| Cancer Deaths Averted | 300 | 300 | 300 | 300 | 100 | 200 |
| Short Term Productivity Losses Averted ($) | $3,621,700 | $4,292,400 | $4,292,400 | $4,292,400 | $1,274,300 | $2,548,600 |
| Long Term Productivity Losses Averted ($) | $8,623,700 | $10,220,700 | $10,220,700 | $10,220,700 | $3,034,300 | $6,068,500 |
| Treatment Costs Averted ($) | $86,463,400 | $102,475,200 | $102,475,200 | $102,475,200 | $30,422,300 | $60,844,600 |
| Intervention costs ($) | $1,300,000 | $1,300,000 | $1,300,000 | $1,300,000 | $1,300,000 | $1,300,000 |
| Incremental QALYs Gained | 3,800 | 4,500 | 4,500 | 4,500 | 1,300 | 2,700 |
Urban
| Compared to Usual Care | AAT | AAT + Standing Orders | AAT + Financial Incentives | AAT + Vaccine Champions | AFIX | STOP HPV |
|---|---|---|---|---|---|---|
| Num. Additionally Vaccinated | 14,900 | 17,700 | 17,700 | 17,700 | 5,200 | 10,500 |
| Cancer Cases Averted | 100 | 200 | 200 | 200 | 100 | 100 |
| Cancer Deaths Averted | 100 | 100 | 100 | 100 | 0 | 0 |
| Short Term Productivity Losses Averted ($) | $704,900 | $835,500 | $835,500 | $835,500 | $248,000 | $496,100 |
| Long Term Productivity Losses Averted ($) | $1,659,800 | $1,967,200 | $1,967,200 | $1,967,200 | $584,000 | $1,168,000 |
| Treatment Costs Averted ($) | $17,424,000 | $20,650,600 | $20,650,600 | $20,650,600 | $6,130,600 | $12,261,300 |
| Intervention costs ($) | $1,300,000 | $1,300,000 | $1,300,000 | $1,300,000 | $1,300,000 | $1,300,000 |
| Incremental QALYs Gained | 800 | 900 | 900 | 900 | 300 | 500 |
Modifiable Parameters
The following parameters that may be modified include: